
Statewise Fish Production in India
This section of the database provides information on Statewise Fish Production in India
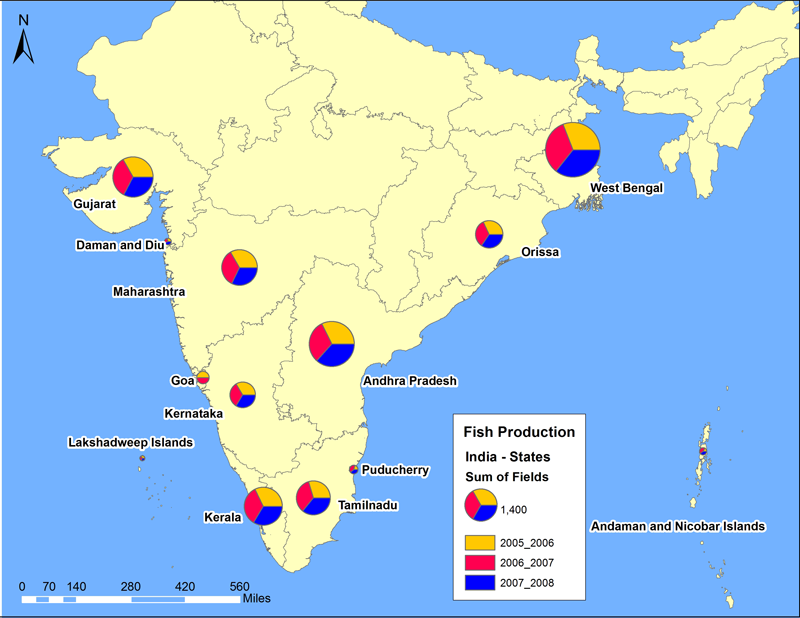
| S.No | State | 2005-06 | 2006-07 | 2007-08 |
| 1 | Gujarat | 733.82 | 747.33 | 721.91 |
| 2 | Maharashtra | 580.55 | 595.94 | 556.45 |
| 3 | Karnataka | 297.57 | 292.46 | 297.69 |
| 4 | Kerala | 636.89 | 677.63 | 667.33 |
| 5 | TamilNadu | 463.03 | 542.28 | 559.36 |
| 6 | Andhrapradesh | 891.09 | 856.93 | 1010.08 |
| 7 | Orissa | 325.45 | 342.04 | 349.48 |
| 8 | West Bengal | 1250 | 1359 | 1447 |
| 9 | Puducherry | 21.45 | 39.66 | 39.01 |
| 10 | Goa | 104.95 | 102.39 | 33.43 |
| 11 | Daman&Diu | 17.79 | 16.41 | 26.36 |
| 12 | Andaman&Nicobar Islands | 12.09 | 28.68 | 28.68 |
| 13 | Lakshadweep | 11.96 | 11.75 | 11.04 |
| Average | 411.28 | 431.73 | 442.14 |